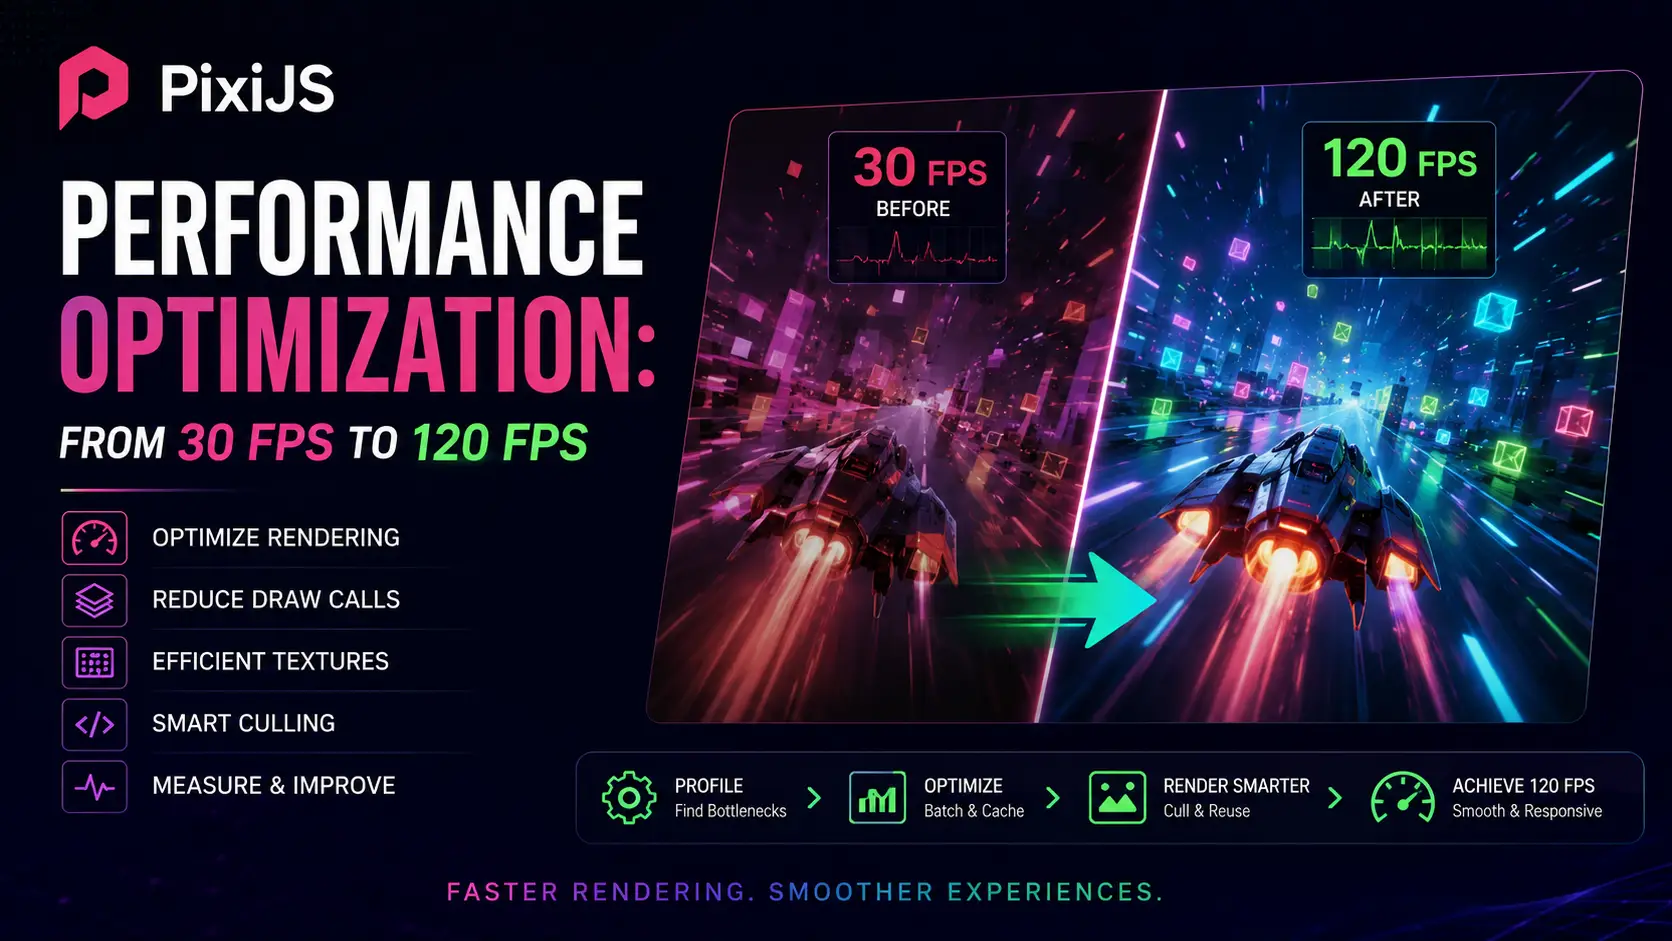
I shipped my first PixiJS game in 2018. It was a simple match-3 with 200 sprites on screen, and it ran at a stable 60 FPS on a 2015 MacBook. Then I added particle effects for the matches — 2,000 particles per chain reaction — and the framerate collapsed to 22 FPS. I spent two weeks learning what PixiJS actually does every frame before I got it back to 60. The lesson was that PixiJS is fast by default but not free, and the difference between 30 FPS and 120 FPS is entirely about understanding the render pipeline. This guide is the documentation I wish I had in 2018. It covers the per-frame work PixiJS does, the optimizations that actually move the needle (batching, texture atlases, ParticleContainer), the hidden costs of filters, memory management, and how to profile with the tools that actually work. Everything here applies to PixiJS 7 and 8; the API has evolved but the underlying rendering model is the same.
The PixiJS render pipeline: what happens every frame
Every frame, PixiJS runs a sequence of steps that turns your scene graph into pixels on screen. Understanding these steps is the prerequisite to optimizing any of them. The pipeline is: traverse the scene graph, sort by z-index, cull invisible objects, build geometry for each visible sprite, batch sprites by texture, upload geometry to the GPU, issue draw calls, present the framebuffer. Scene graph traversal is recursive, walking every container and every child. For 1,000 sprites, this is roughly 1,000 function calls per frame — not a problem. For 100,000 sprites, traversal alone can take 5-10 milliseconds, which is a significant chunk of your 16ms budget at 60 FPS. The fix is to use ParticleContainer (covered below) for large collections of similar sprites, which bypasses the normal traversal. Z-index sorting happens after traversal. By default, PixiJS sorts siblings by their z-index property. Sorting 1,000 siblings takes about 0.1 milliseconds. Sorting 10,000 siblings takes 1-2 milliseconds. If you have many siblings with z-index set, consider using zIndex = 0 for all of them and relying on insertion order instead. Or restructure the scene graph so siblings are grouped into containers with smaller sibling counts. Culling is the check for whether a sprite's bounds intersect the viewport. PixiJS does not cull by default; you have to opt in via the cull plugin or implement it manually. For scenes much larger than the viewport (a side-scrolling game level, a map), culling is essential. Without culling, PixiJS builds geometry for off-screen sprites, which is wasted CPU and GPU work. Geometry building is where PixiJS converts each sprite into vertex data: 4 vertices (one per corner) with position, UV, and color attributes. For 1,000 sprites, that is 4,000 vertices, built every frame. The default geometry builder is fast (about 0.5 milliseconds for 1,000 sprites) but can be skipped for sprites that have not changed since the previous frame by setting the sprite's transformAutoUpdate flag appropriately. Batching is the most important optimization in PixiJS. Sprites that share the same texture (or textures in the same atlas) and the same blend mode can be drawn in a single draw call. The default batch size is 4096 vertices, which is 1,024 sprites. So 1,000 sprites sharing a texture fit in one draw call, while 2,000 sprites sharing a texture require two draw calls. The number of draw calls is the single best predictor of PixiJS performance — fewer is always faster. GPU upload happens when geometry changes. PixiJS uploads vertex and index data to GPU buffers every frame, unless you mark the geometry as static. For static UI elements, mark them as static to skip the upload. For animated sprites, you cannot avoid the upload, but you can minimize it by not changing sprite properties you do not need to change. Draw calls are issued at the end. Each draw call has a fixed overhead of about 0.05-0.1 milliseconds on a desktop GPU and 0.5-1 millisecond on a mobile GPU. So 100 draw calls is 5-10 milliseconds on mobile, which is a significant fraction of your frame budget. Batching exists to minimize draw calls, which is why it is the most impactful optimization. 60 FPS gives you 16.6 milliseconds per frame. 120 FPS gives you 8.3 milliseconds. The work distribution in a typical optimized PixiJS app at 60 FPS: scene graph traversal 1-2ms, geometry building 1-2ms, batching 0.5-1ms, GPU upload 1-2ms, draw calls 1-3ms, JavaScript overhead (event handlers, game logic) 2-5ms. That sums to 6.5-15ms, which is why hitting 60 FPS is achievable and hitting 120 FPS is hard.
Batching and texture atlases: the single highest-impact optimization
Batching is the single most important PixiJS optimization. PixiJS batches sprites that share the same texture, blend mode, and shader into a single draw call. The default batch size is 4096 vertices (1,024 sprites), so up to 1,024 sprites that share a texture draw in one call. The cost of one draw call is approximately 0.1ms on desktop, 0.5ms on mobile — so 100 draw calls is 10ms on mobile, which is most of your 60 FPS budget. The way to maximize batching is to use a texture atlas. A texture atlas is a single large texture that contains many small images. PixiJS treats the atlas as a single texture, so all sprites using different parts of the atlas batch into a single draw call. Without an atlas, 100 different sprites = 100 draw calls. With an atlas, 100 different sprites = 1 draw call. This is a 100x reduction in draw call overhead. TexturePacker is the standard tool for creating atlases. It takes a folder of PNGs and outputs a single atlas PNG plus a JSON file describing the sprite locations. PixiJS's Assets loader reads this JSON natively. The alternative is Shoebox (free, but less polished) or PixiPacker (web-based). For simple cases, you can build atlases by hand in Photoshop or GIMP, but the JSON generation is tedious. Atlas size limits matter. The maximum texture size on a modern GPU is 16384x16384, but mobile GPUs often cap at 4096x4096, and older devices at 2048x2048. For broad compatibility, use 2048x2048 atlases. For modern devices, 4096x4096 is safe. Beyond that, you need to split into multiple atlases, which means PixiJS will need to switch textures between draw calls — losing some batching benefit. Multi-texture batching, introduced in PixiJS 7, lets you bind multiple textures simultaneously (up to the GPU's texture unit limit, typically 16 on desktop, 8 on mobile). This means sprites from different atlases can still batch into a single draw call, as long as the total number of unique textures is under the limit. Enable it with renderer.options.maxTextures = 16. This is particularly useful for UI layers where you have a few small atlases for different themes. Batching breaks when sprites have different blend modes or different shaders. A sprite with normal blend mode will not batch with a sprite with additive blend mode, even if they share a texture. Plan your scene graph to group sprites with the same blend mode together. Similarly, custom shaders break batching — sprites using a custom filter or shader do not batch with sprites using the default shader. The PixiJS stats panel (available via @pixi/stats or the built-in Stats widget) shows draw calls per frame. If you are rendering 1,000 sprites and seeing 100+ draw calls, your batching is broken. The most common cause is missing atlases; the second most common is mixed blend modes. Fix those and you will typically see draw calls drop to single digits. A real example from a project I worked on: a slot machine game with 30 reels, each containing 20 symbols. Without atlases, this was 600 draw calls per frame at 8 FPS on mobile. After atlasing all symbols into a single 2048x2048 texture, draw calls dropped to 1 and the framerate hit 60 FPS. Same game, same hardware, 60x improvement — entirely from batching.
ParticleContainer: 10x faster for particles
ParticleContainer is a specialized container for sprites that have simple, uniform properties. It bypasses the normal scene graph traversal and renders all its children in a single optimized draw call. The performance difference is dramatic: 10,000 particles in a regular Container takes about 8 milliseconds per frame; the same 10,000 particles in a ParticleContainer takes about 0.8 milliseconds. The catch is that ParticleContainer has limitations. Children cannot have rotation or non-uniform scale (only position and uniform scale). Children cannot have filters or masks. Children cannot have interactive hit areas. ParticleContainer itself cannot be nested (you cannot put a ParticleContainer inside another ParticleContainer). These limitations are what enable the speed — the renderer knows every child looks the same and can skip the per-sprite property checks. Use cases: snow, rain, sparks, debris, smoke, fireflies, confetti, background star fields. Anywhere you have many simple sprites with the same texture, ParticleContainer is the right choice. For particles with rotation (spinning debris), use a regular Container or implement a custom shader. Constructor options matter. ParticleContainer constructor takes (maxSize, properties, batchSize). maxSize is the maximum number of children; pre-allocated for performance. properties is an object with boolean flags for which properties are dynamic: { vertices, position, rotation, uvs, tint }. Set only the properties you will change to true; setting properties to false lets PixiJS skip work. For typical particle effects, set { position: true, vertices: false, rotation: false, uvs: false, tint: true }. Memory management for ParticleContainer: when you remove a particle, call particle.destroy() to free its resources. Do not just removeChild() — the particle's texture and geometry remain in GPU memory until destroyed. For long-running particle systems, pool particles instead of creating and destroying them. A simple object pool keeps a queue of dead particles and reuses them when new particles are needed, avoiding GC pressure. ParticleContainer does not support filters, but you can filter the entire container by applying a filter to a parent. This is useful for global effects like color grading or bloom applied to all particles. The filter cost is per-pixel of the filtered area, so for large particle systems this can be expensive. When to avoid ParticleContainer: anything with non-uniform scaling (a sprite that stretches horizontally but not vertically), anything with rotation that needs to be individually controlled, anything that needs filters or masks per-sprite, anything that needs accurate hit testing. For these cases, use a regular Container and accept the performance cost — or restructure the scene to avoid the per-sprite requirement.
Filters and their hidden costs
Filters are PixiJS's abstraction over fullscreen post-processing shaders. They look free in the API — sprite.filters = [new BlurFilter(8)] — but each filter is an additional render pass with significant cost. Understanding the cost structure is essential for performance work. Each filter works by rendering the filtered content to an offscreen texture, running the filter shader on that texture, and rendering the result back to the main framebuffer. This means each filter adds at least two render passes (one to the offscreen, one back). Blur filters, which are separable, add three passes (horizontal blur, vertical blur, composite). The filter area is the bounding rectangle of the filtered content, padded to accommodate the filter's needs (blur needs padding equal to the blur radius). The cost of a filter is proportional to the filter area, not to the visible content. A small sprite with a large blur filter can cost more than a large sprite with a small blur, because the filter area is padded out to the blur radius. Filter textures are allocated every frame by default. PixiJS reuses textures via the FilterState pool, but the pool is sized dynamically, so the first few frames after a filter is added will be slow as the pool grows. For consistent performance, pre-warm the pool by applying the filter for a few frames before showing it to the user. Stacking filters multiplies cost linearly. Three filters on one sprite = three render passes = three times the cost of one filter. PixiJS does not combine filters automatically (with the exception of certain built-in combinations). For complex looks, write a single custom filter that does everything in one pass — this can be 3-5x faster than stacking built-in filters. The BlurFilter is the most expensive built-in filter. A BlurFilter(8) on a 1024x1024 sprite costs about 4 milliseconds on desktop, 15-20 milliseconds on mobile. For mobile-targeted projects, consider BlurFilterPass with reduced quality, or implement a cheaper blur (Kawase blur is ~2x faster than Gaussian for similar visual quality). The DisplacementFilter is much cheaper — one render pass, one extra texture fetch per pixel. It is the right choice for water ripples, glass distortion, and similar effects. The displacement map can be animated cheaply by scrolling a noise texture. Custom filters can be cheap or expensive depending entirely on the shader. A grayscale filter (one line of GLSL) is essentially free. A multi-pass bloom filter with threshold, blur, and composite is expensive. The cost is determined by the number of texture fetches in the shader and the number of passes. Filter pooling can be configured. PixiJS's FilterPool (accessible via renderer.filter) manages the offscreen textures. For predictable performance, you can pre-allocate the pool to your expected filter size. This avoids the GC pressure of allocating and deallocating large textures every frame. A common mistake: applying filters to the entire stage when you only need to filter a small area. Apply filters to specific containers, not to the stage, to minimize filter area. If you need a global effect, consider rendering the scene to a texture and applying the filter to that texture with explicit size control, rather than letting PixiJS use the stage bounds. When in doubt, profile. The Spector.js browser extension shows every render pass, every texture, every shader. If you see 30 render passes per frame, you have a filter problem. Most optimized PixiJS apps have under 10 render passes per frame.
Memory management and texture lifecycle
Textures are GPU memory, and GPU memory is not garbage collected. If you create a texture and lose the JavaScript reference to it, the GPU memory is not freed — it stays allocated until you explicitly destroy it. This is the source of the most common PixiJS memory leak. The correct destruction pattern for a sprite is sprite.destroy({ texture: true, baseTexture: true }). The texture: true flag destroys the sprite's texture; the baseTexture: true flag destroys the underlying base texture (the GPU resource). If multiple sprites share a base texture, destroying it via one sprite breaks the others — so use baseTexture: true only when you are sure no other sprite uses the same base texture. The PixiJS TextureCache (accessible via Texture.from('textureId') or the Assets cache) keeps references to loaded textures. When you remove a sprite, the texture remains in the cache and continues to consume GPU memory. To fully release a texture, you must also remove it from the cache: Texture.removeFromCache('textureId') or Assets.cache.remove('textureId'). Common leak pattern: a game with multiple levels. Each level loads new textures and creates sprites using those textures. When the level ends, sprites are removed from the stage but their textures are not destroyed or removed from the cache. After 10 levels, the GPU has 10 levels worth of textures loaded — typically 200-500 MB on a mobile GPU with 1-2 GB of memory. Eventually the GPU runs out of memory and the game crashes. The fix is a level-unload routine that explicitly destroys all textures loaded for the level. Maintain a list of textures loaded for each level, and on level transition, destroy them in order. This is tedious but essential for any multi-level PixiJS app. Chrome DevTools can help. Open DevTools > Performance > Memory and record a session. Look for growing GPU memory — if it grows monotonically over a few minutes, you have a leak. The Memory tab also shows JavaScript heap allocations, which can identify leaks on the JS side (e.g., event listeners holding references to destroyed sprites). Texture preloading is the opposite side of the coin. Loading a texture mid-frame causes a stutter — the upload of texture data to the GPU takes 5-50 milliseconds depending on size. For smooth performance, preload all textures you will need for the current scene before the scene starts. PixiJS's Assets loader supports preloading via Assets.load(['url1', 'url2']). Mipmap generation is a one-time cost at texture upload. For textures you will downsample (backgrounds, large sprites), enable mipmaps: baseTexture.mipmap = PIXI.MIPMAP_MODES.POW2. For UI textures that always render at 1:1, disable mipmaps to save 33% texture memory. Premultiplied alpha is the default in PixiJS and is correct for almost all cases. The only time to disable it is when you need to do additive blending with semi-transparent sprites, which requires non-premultiplied alpha. Disabling premultiplied alpha breaks batching with premultiplied sprites, so use it sparingly.
Profiling tools: Spector.js, Chrome DevTools, and what to look for
Profiling is the only way to know what is actually slow. Guessing at performance problems wastes time and often makes things worse. The tools that matter for PixiJS are Spector.js, Chrome DevTools Performance tab, and the PixiJS stats widget. Spector.js is a browser extension that captures a single frame of WebGL activity and shows every draw call, every texture, every shader, every framebuffer. It is the gold standard for WebGL debugging and is essential for understanding PixiJS performance. Install it, click capture, and you get a frame-by-frame breakdown of what the GPU did. What to look for in Spector.js: number of draw calls (target under 50 for mobile, under 200 for desktop), number of texture uploads per frame (target 0 — uploads should happen during loading, not during rendering), number of framebuffer switches (each filter adds at least 2), and shader compilation events (should be 0 during normal rendering — shaders compile once at startup). Chrome DevTools Performance tab shows JavaScript time per frame. Record a 5-second session while your app runs, then look at the flame chart. PixiJS-specific things to look for: Renderer.render (the main render call), Container.render (per-container traversal), BatchRenderer.flush (draw call submission), and any of your own update functions. The JavaScript budget at 60 FPS is 16ms; at 120 FPS it is 8ms. If your flame chart shows 10ms of PixiJS work plus 10ms of your game logic, you are over budget at 60 FPS. Chrome DevTools also has a Rendering tab with FPS meter, GPU time, and layer boundaries. Enable the FPS meter to see real-time framerate. Enable GPU time to see how much of each frame is spent on GPU work versus CPU work. If GPU time is high, you are bottlenecked on rendering (draw calls, fill rate, shaders). If GPU time is low but frame time is high, you are bottlenecked on JavaScript. The PixiJS stats widget (from @pixi/stats or PIXI.StatsWidget) shows real-time draw call count, texture count, and geometry count. Pin it to the corner of your screen during development. If draw call count spikes when you add a feature, you have introduced a batching break. If texture count grows over time, you have a leak. Common bottlenecks and their fixes: too many draw calls (fix with atlases and batching), too many sprites (fix with ParticleContainer or culling), too much JavaScript (fix by moving logic to workers or simplifying update loops), too much GPU time per draw call (fix by reducing shader complexity or render resolution), too many filters (fix by combining filters or removing them). A specific tip: PixiJS's accessibility plugin (enabled by default) adds ARIA attributes and tabindex to sprites, which is expensive. For games and visual applications where accessibility is not needed, disable it: app.renderer.plugins.accessibility.destroy(). This typically saves 1-2 milliseconds per frame. Another tip: avoid changing sprite properties every frame if you do not need to. Setting sprite.x = sprite.x does not skip the transform update — PixiJS marks the transform dirty regardless. Cache previous values and only set when changed. For 10,000 sprites, this can save 2-3 milliseconds per frame. Finally, profile on your target hardware. A feature that runs at 60 FPS on your M2 MacBook might run at 20 FPS on a mid-range Android phone. Test on real devices, ideally the slowest device you intend to support. The performance characteristics of mobile GPUs are radically different from desktop — fill rate is much lower, texture bandwidth is much lower, and shader complexity matters more.
Conclusion
PixiJS is fast by default and extremely fast with optimization. The optimizations that matter, in order of impact: use texture atlases to maximize batching, use ParticleContainer for particles, minimize filters and combine them where possible, manage texture lifecycle explicitly to avoid leaks, and profile continuously with Spector.js. The difference between a 30 FPS and a 120 FPS PixiJS app is rarely about the library — it is about understanding what the library does every frame and making sure you are not asking it to do unnecessary work. Once you internalize the render pipeline, optimization becomes systematic rather than guesswork. Every performance problem has a specific cause visible in Spector.js or DevTools, and every cause has a known fix. The work is in the diagnosis, not the fix.